
A clearer view of progress on site.
This example brings together repeat aerial capture, measurable outputs and an accessible visual record in a format that can be shared with project teams, clients and stakeholders.
Project information in one place.
Repeat aerial capture turns site activity into a consistent visual and measurable project record.
Fly over the site, then inspect the detail.
A repeatable combination of video and high resolution aerial imagery gives project teams a clear record of site conditions, access, interfaces and visible progress without relying on scattered photos or individual site visits.
Detailed site context
Select either image to open it at full size. These views complement the mapped outputs with an immediate visual record of site activity and condition.
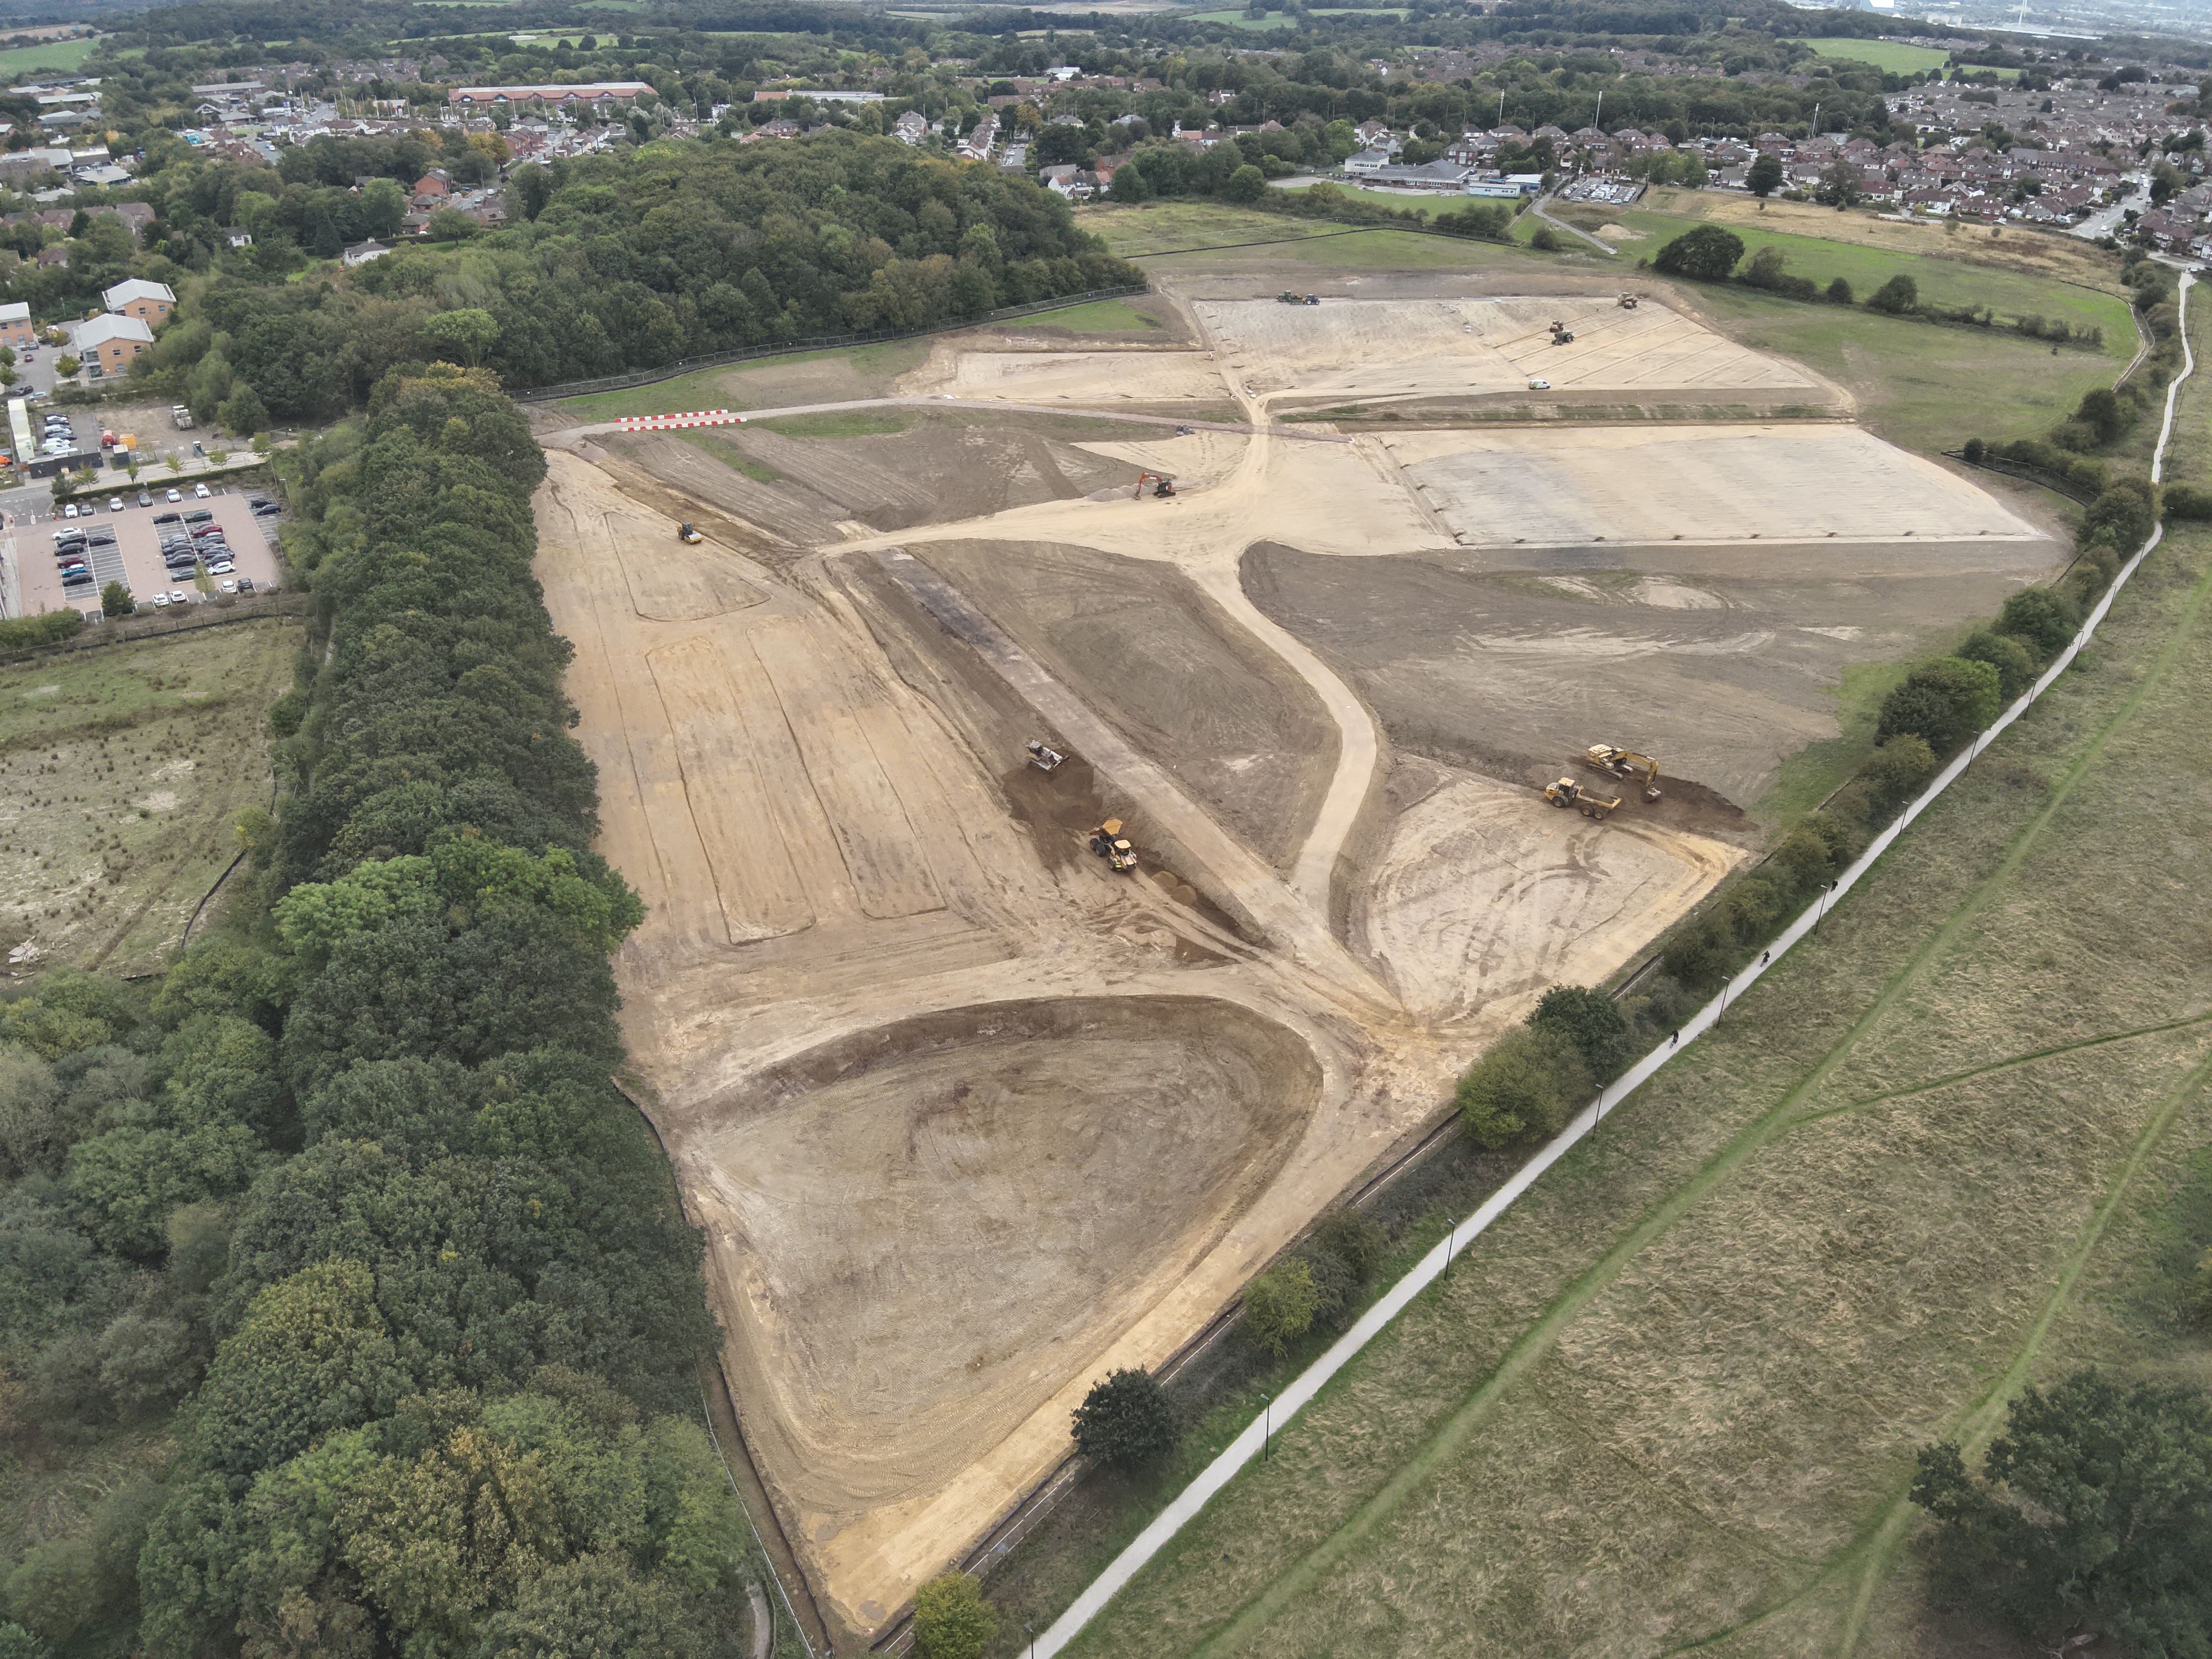 Aerial image 01 • Open
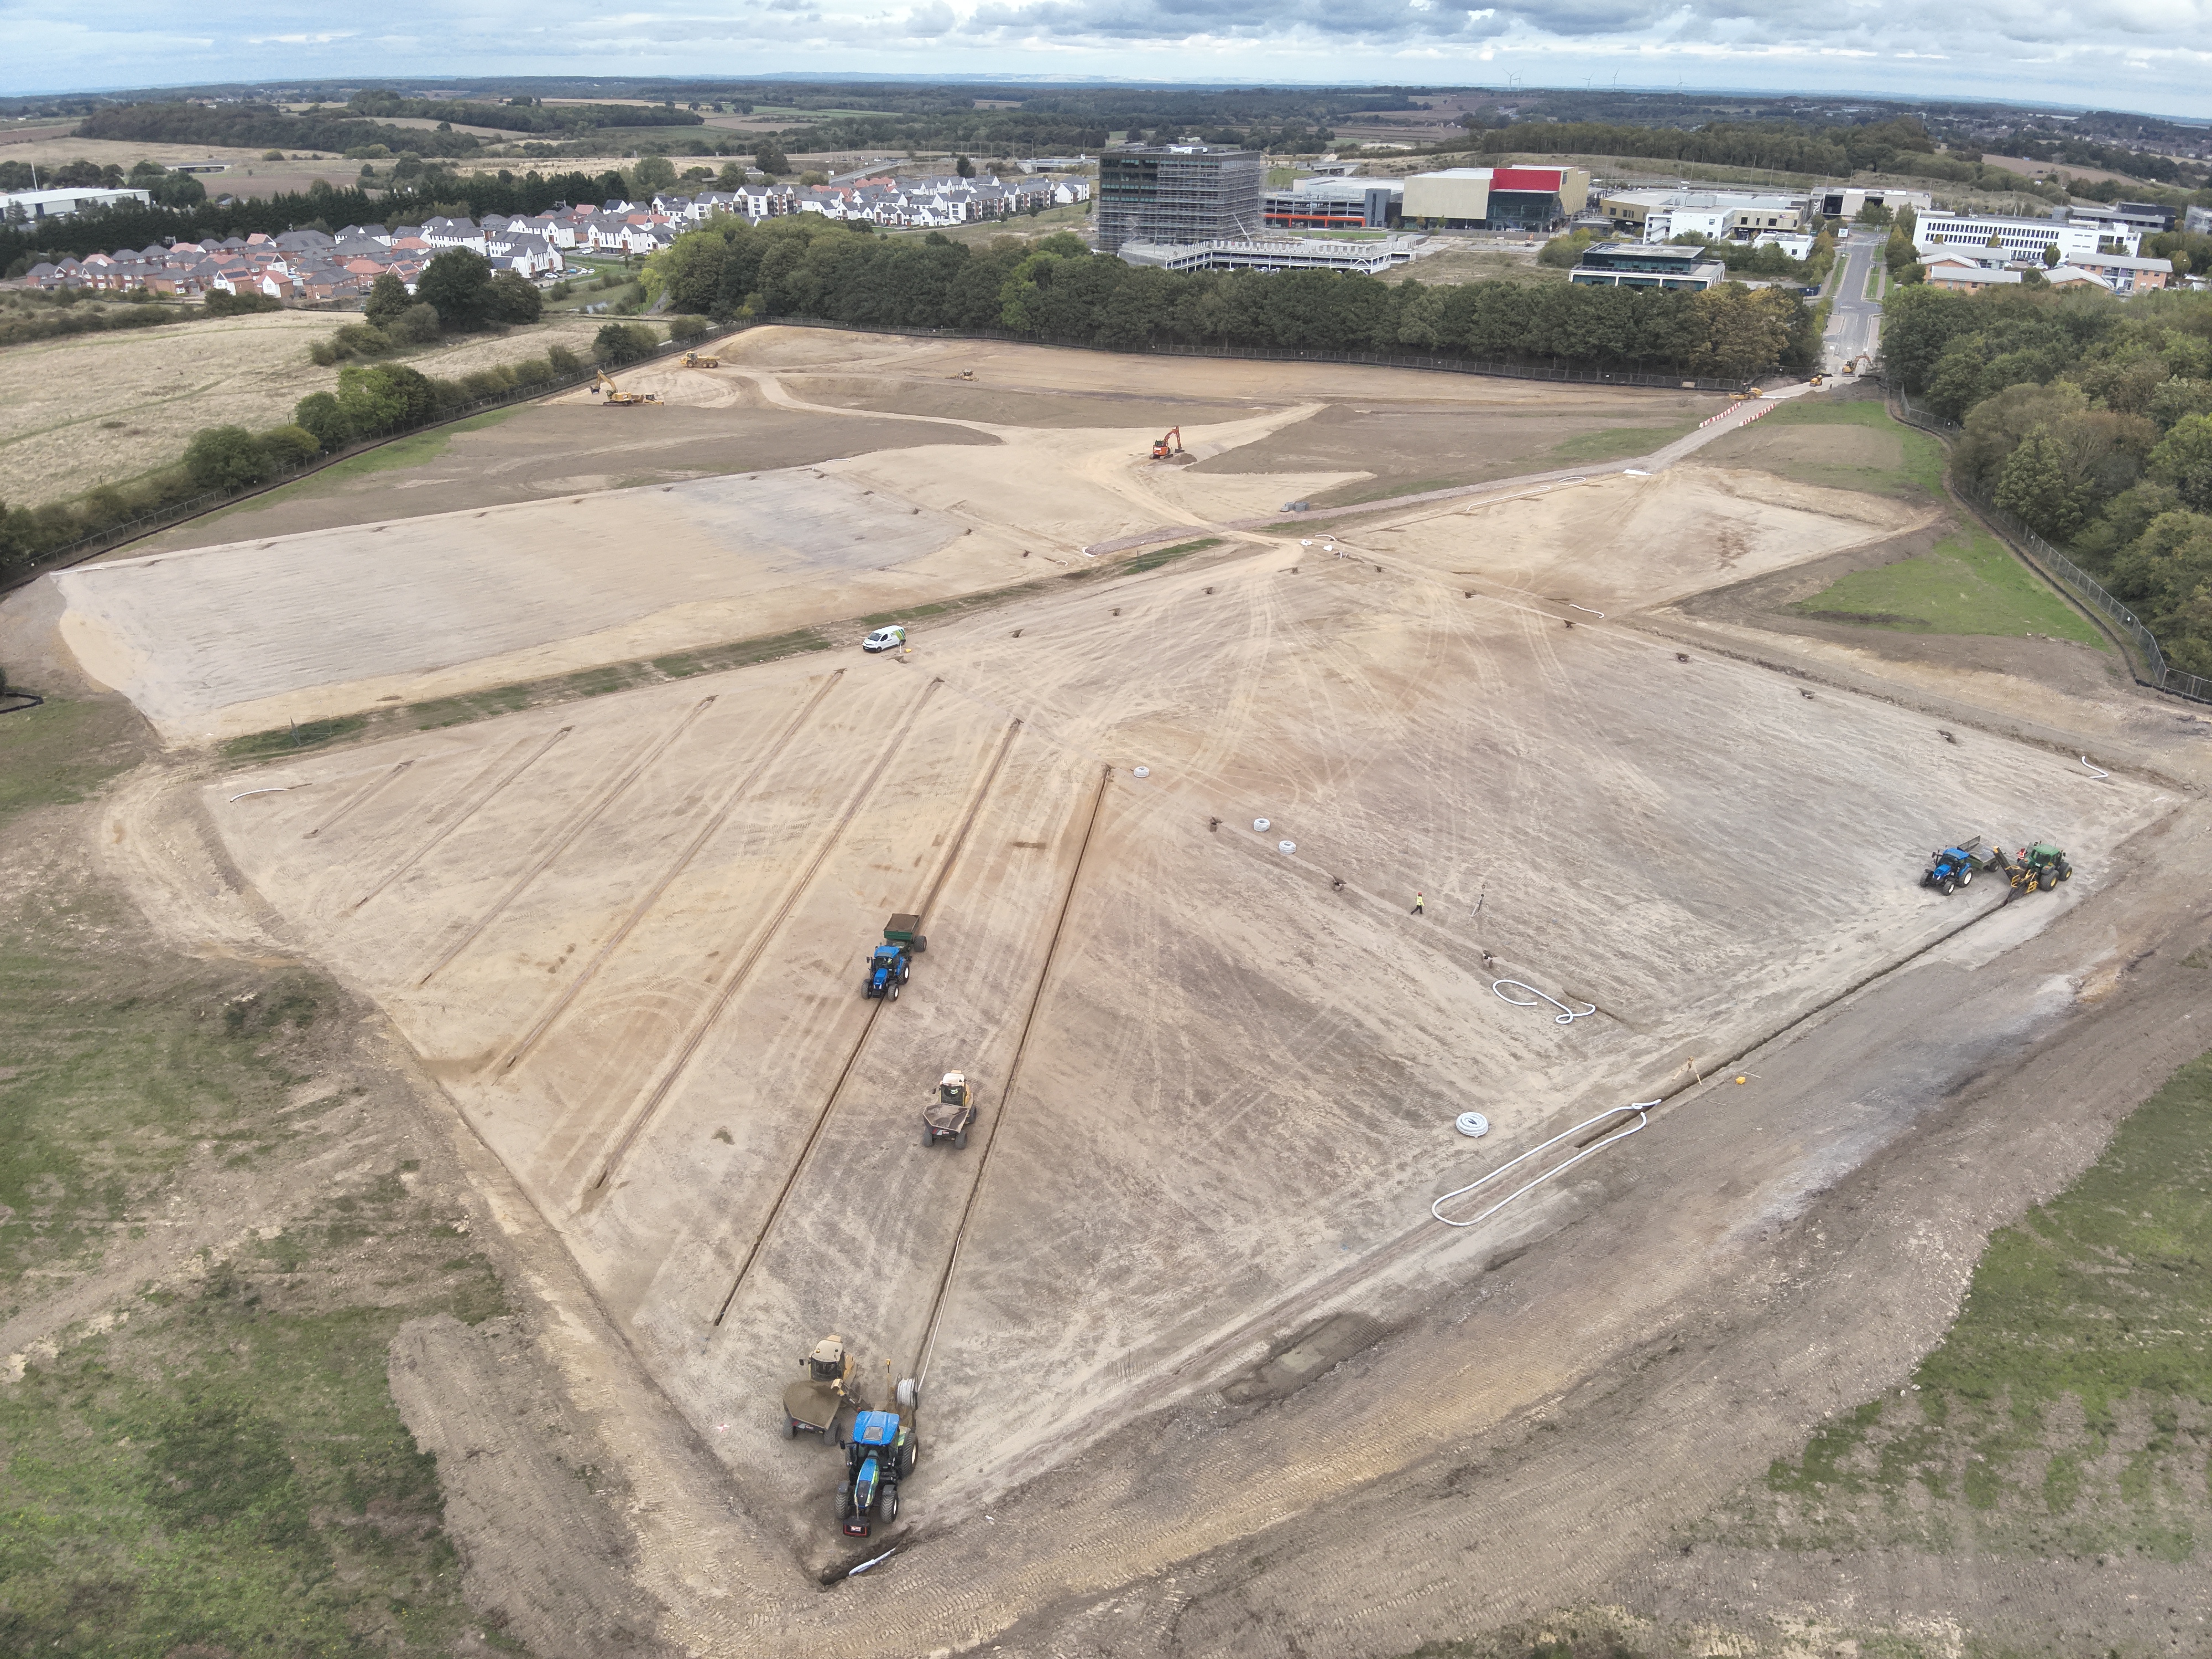 Aerial image 02 • Open
Progress that can be seen, measured and discussed.
The comparison below shows how aerial updates can support progress reporting with a visual record of change and a simple headline view of physical completion.
Aligned repeat imagery gives the team a consistent reference point for meetings, reporting and day to day review.
Demonstration analytics only. In a live deployment, these figures can be refined using repeat DSM or point cloud comparison against agreed work areas and programme quantities.
One position. Five stages of site change.
Move through the timeline to inspect gradual change between captures. The fade is deliberately gentle to make small changes easier to read.
Take dimensions directly from the latest capture.
The orthophoto becomes a practical working surface rather than a static image, allowing quick checks on distances and areas without leaving the viewer.
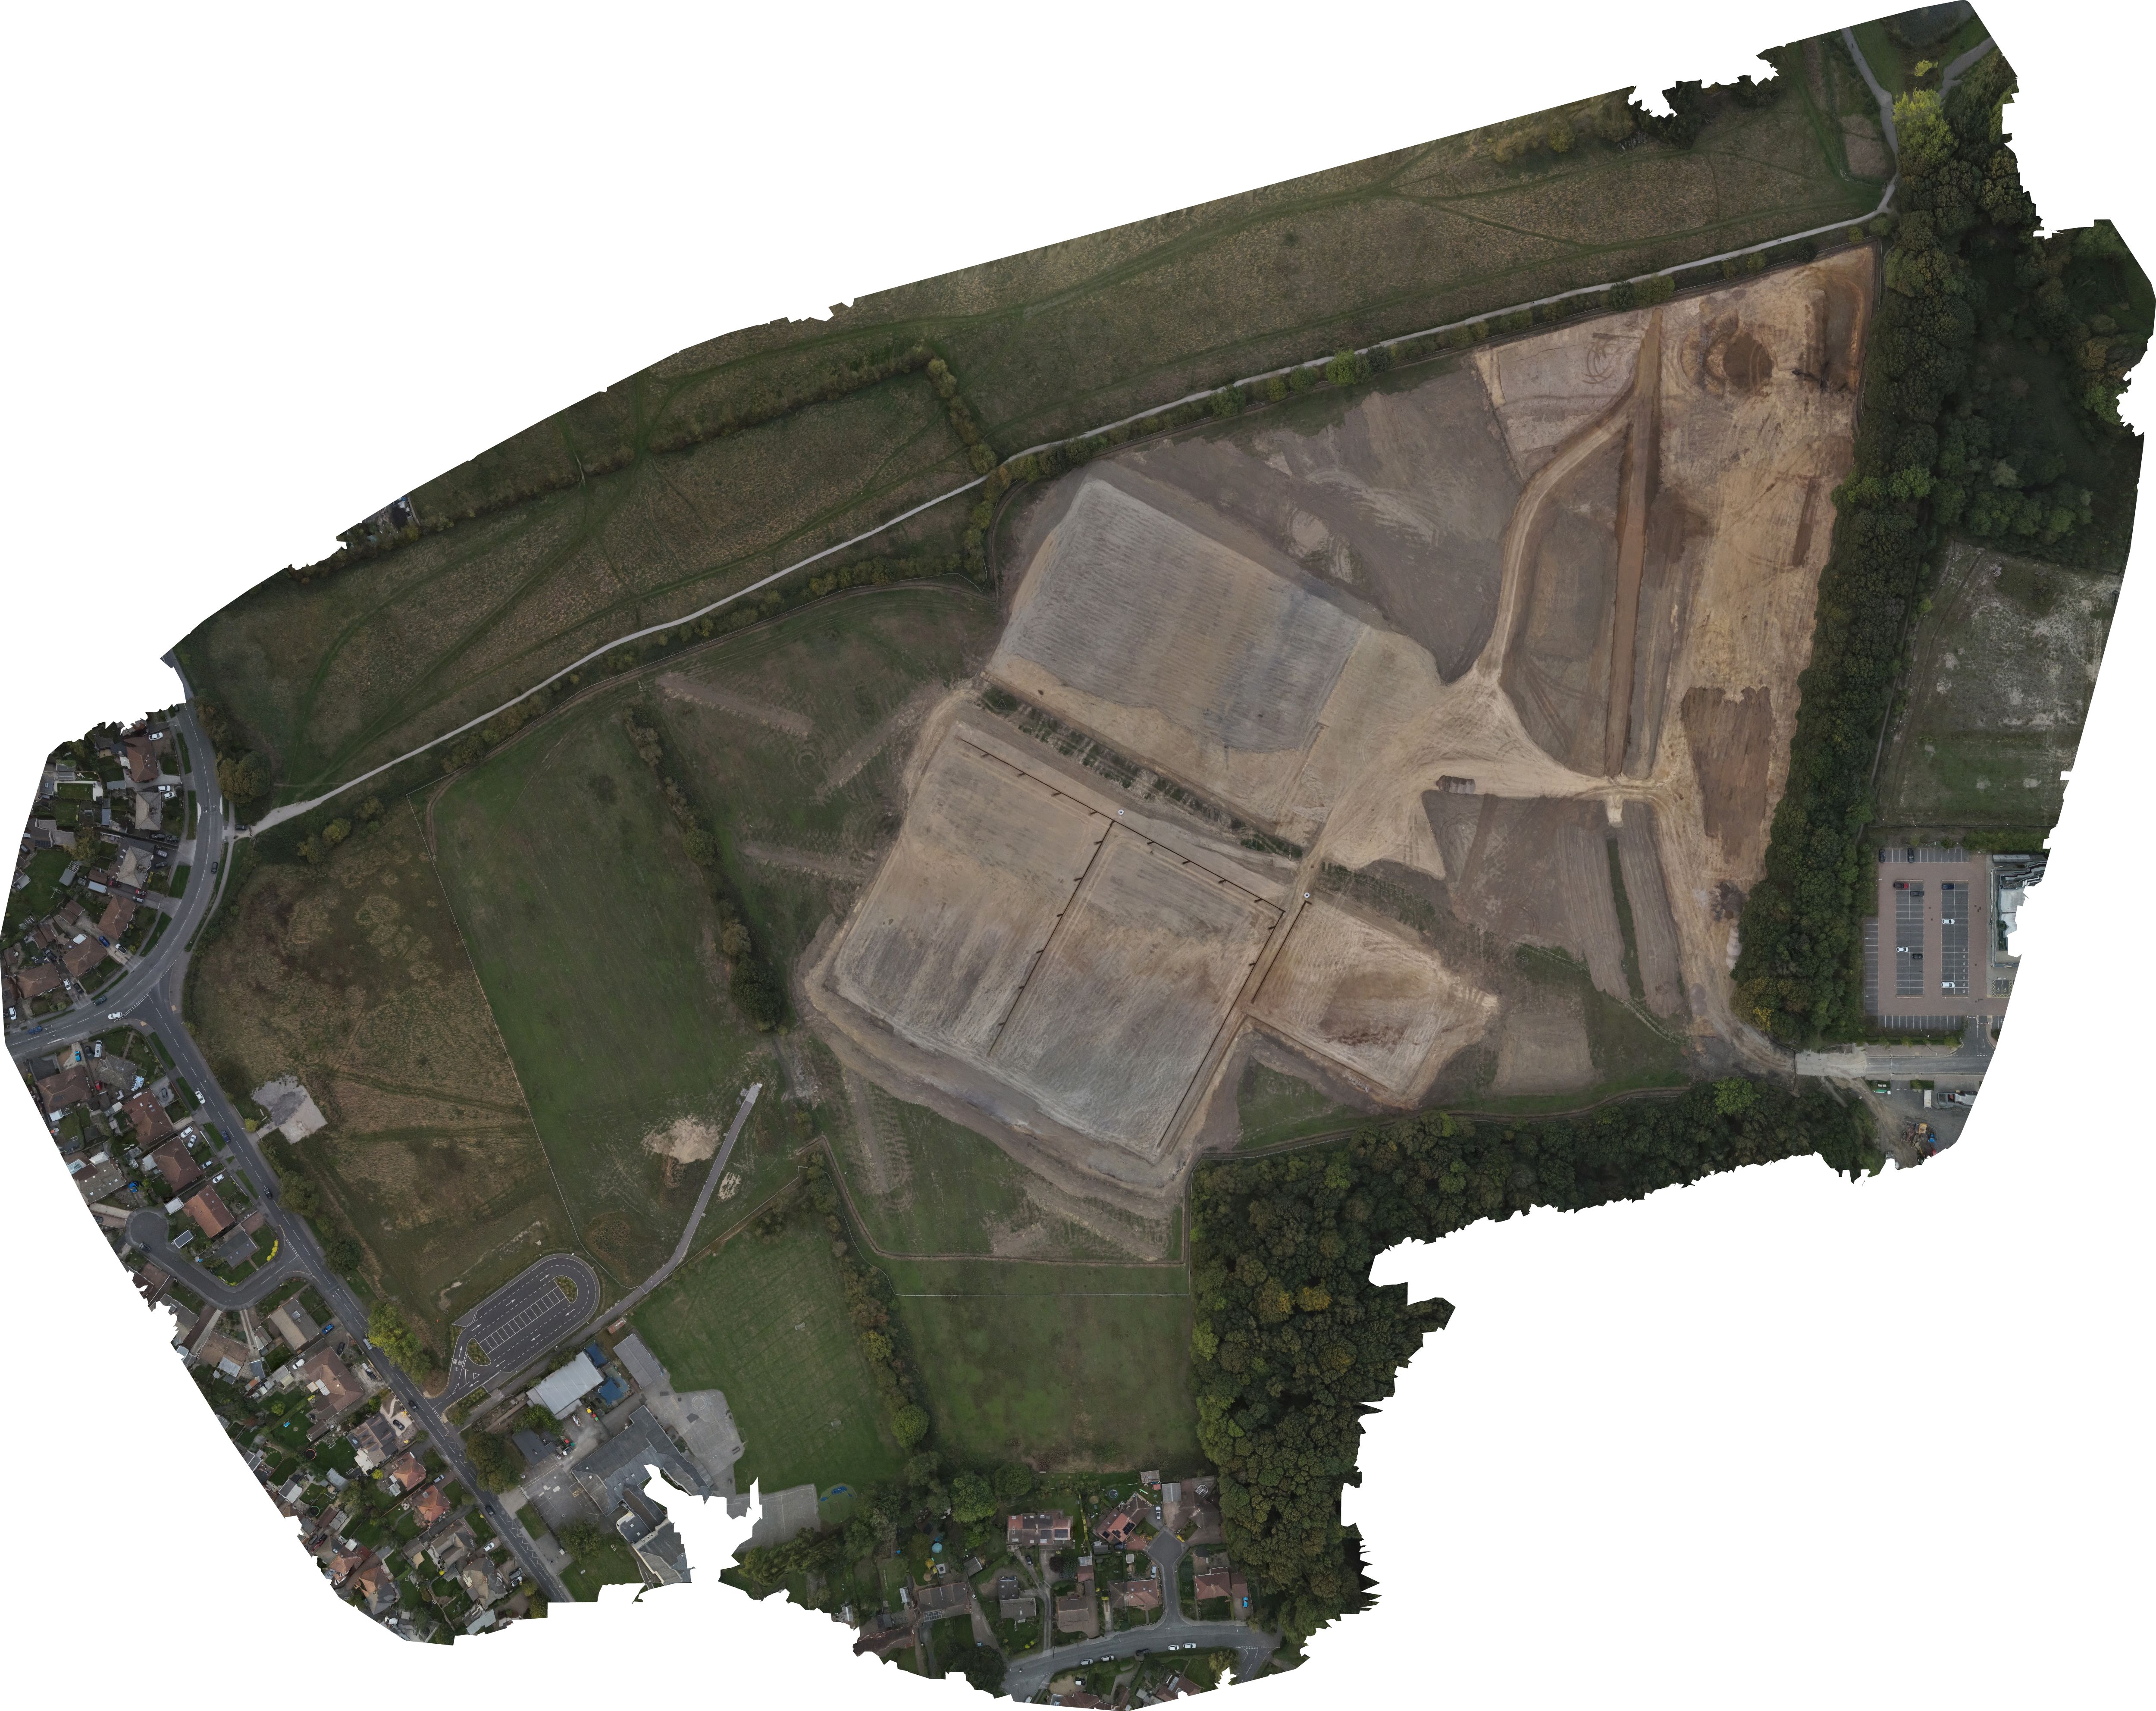
Click points on the orthophoto.
Choose distance or area. Click to place measurement points. When zoomed in, drag the orthophoto to pan around the site. Zooming and panning do not affect the measurement scale.
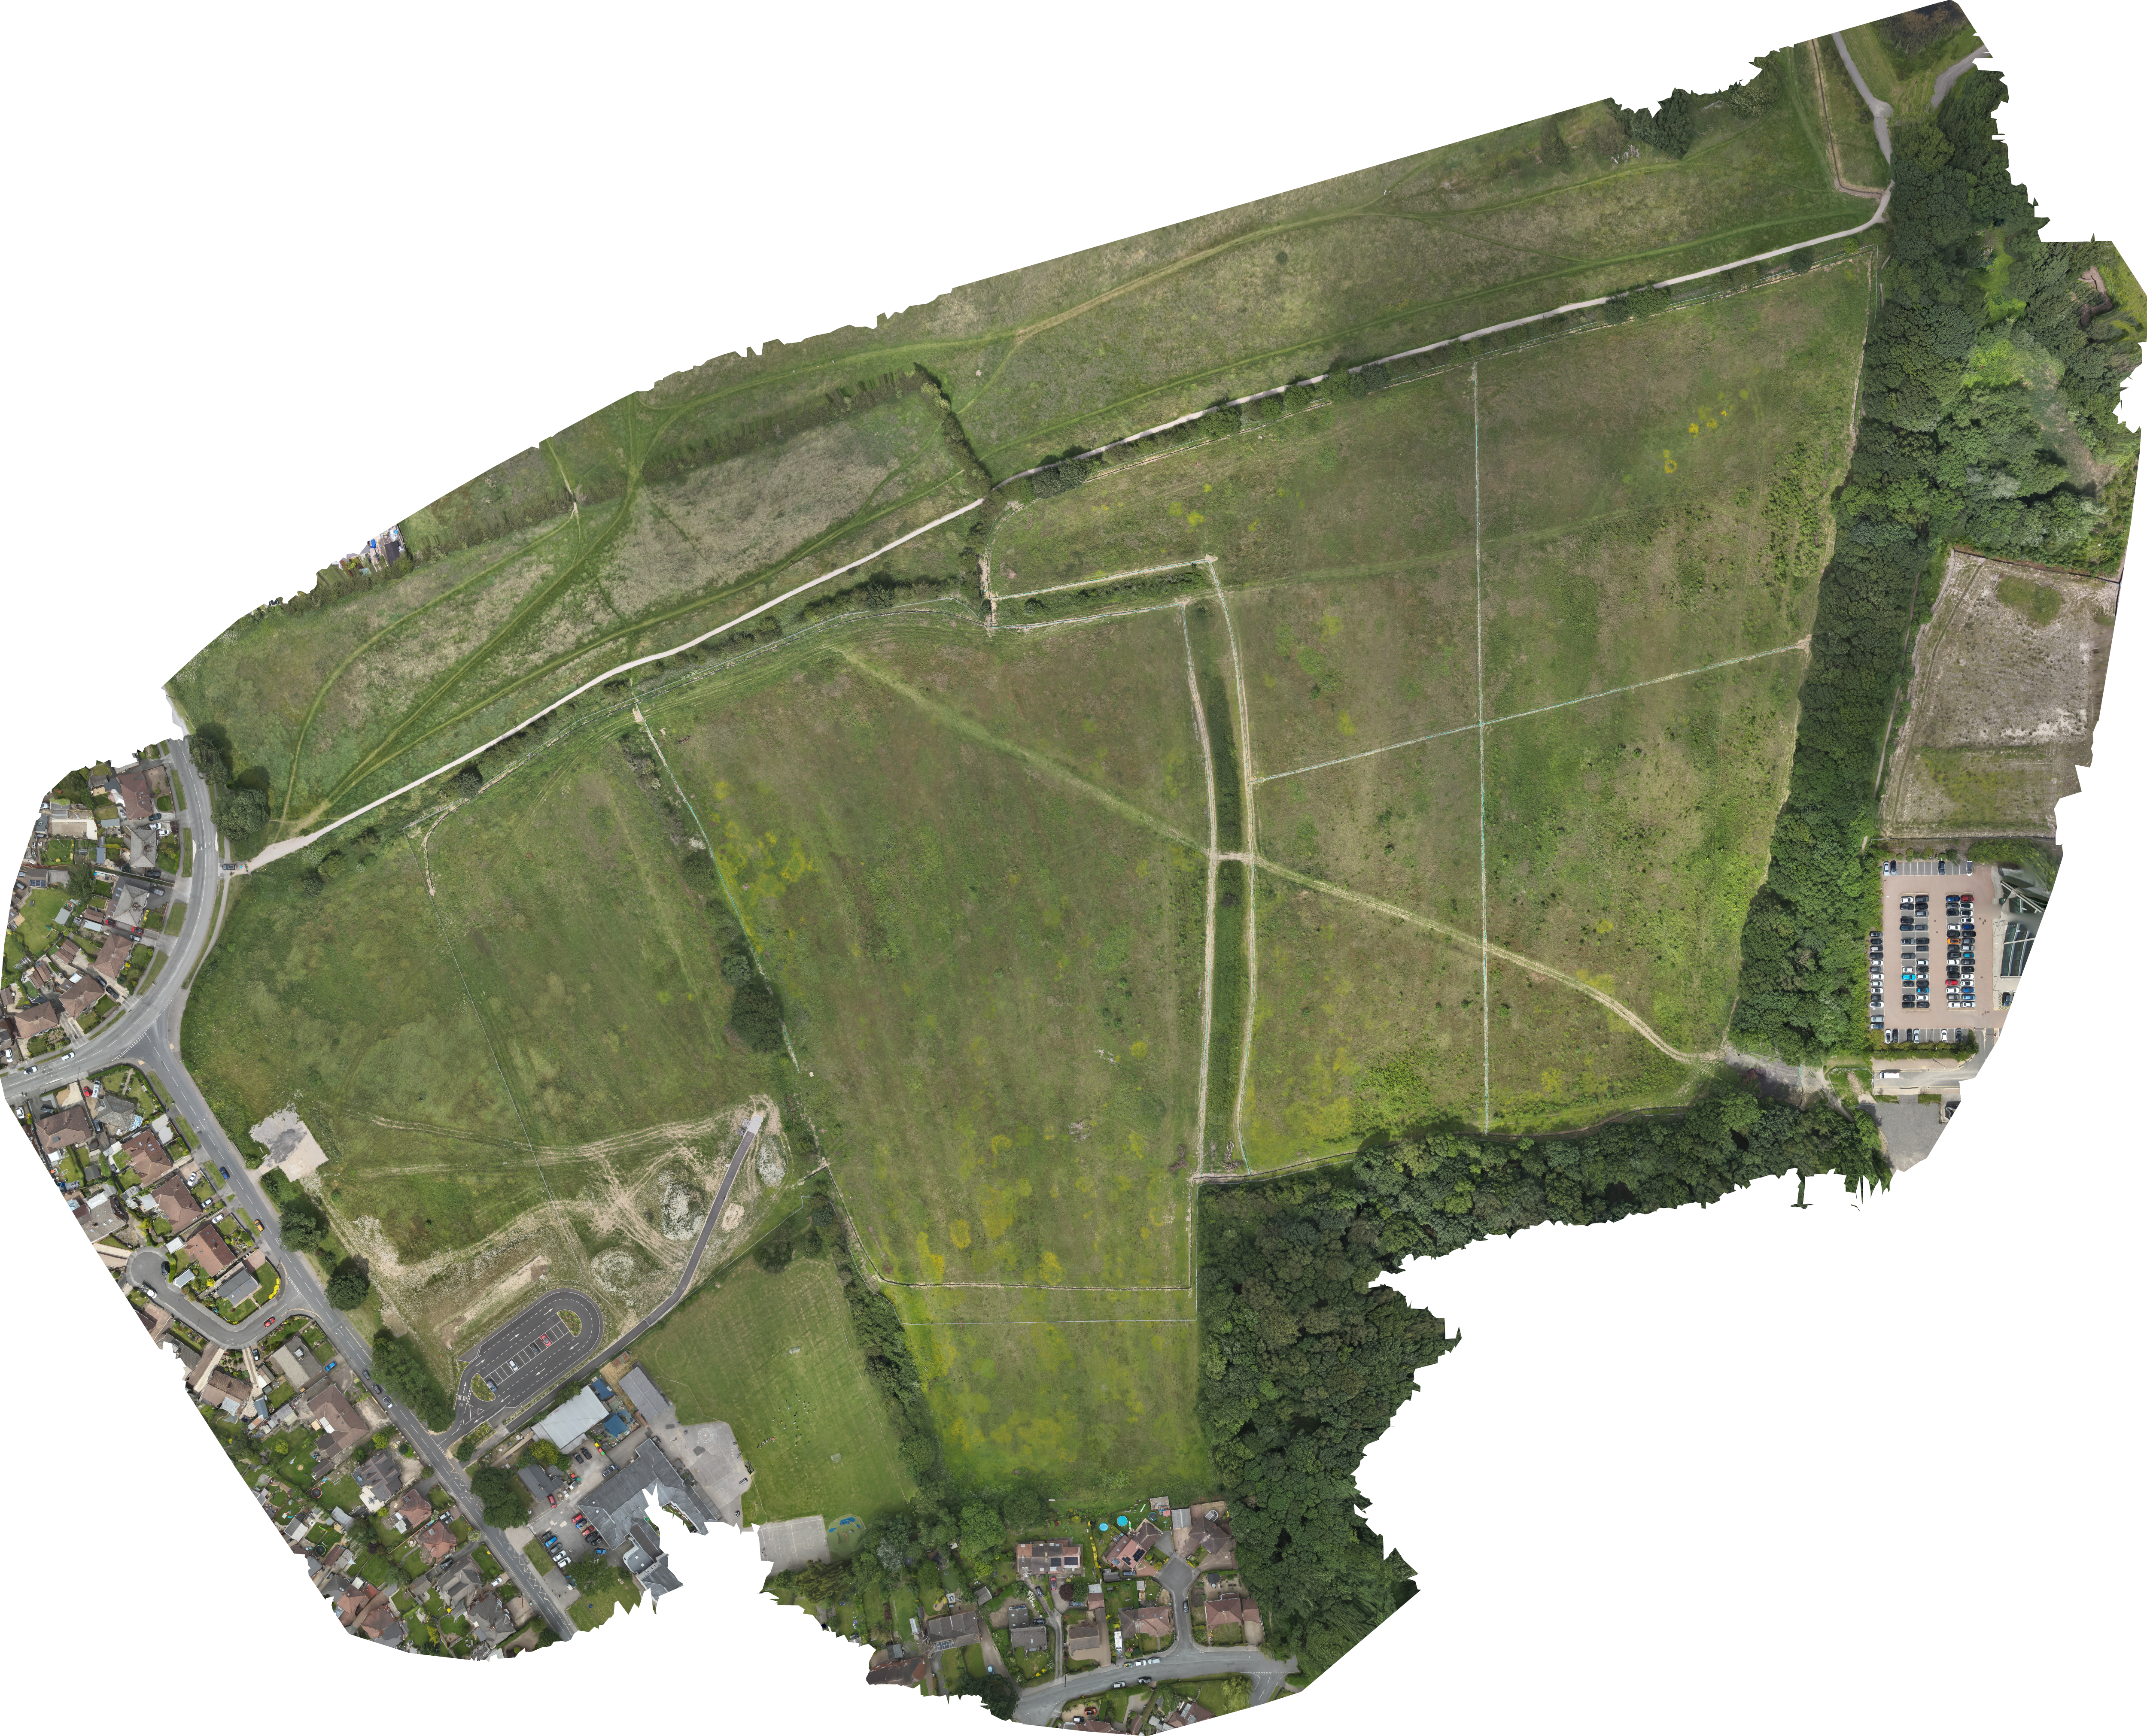
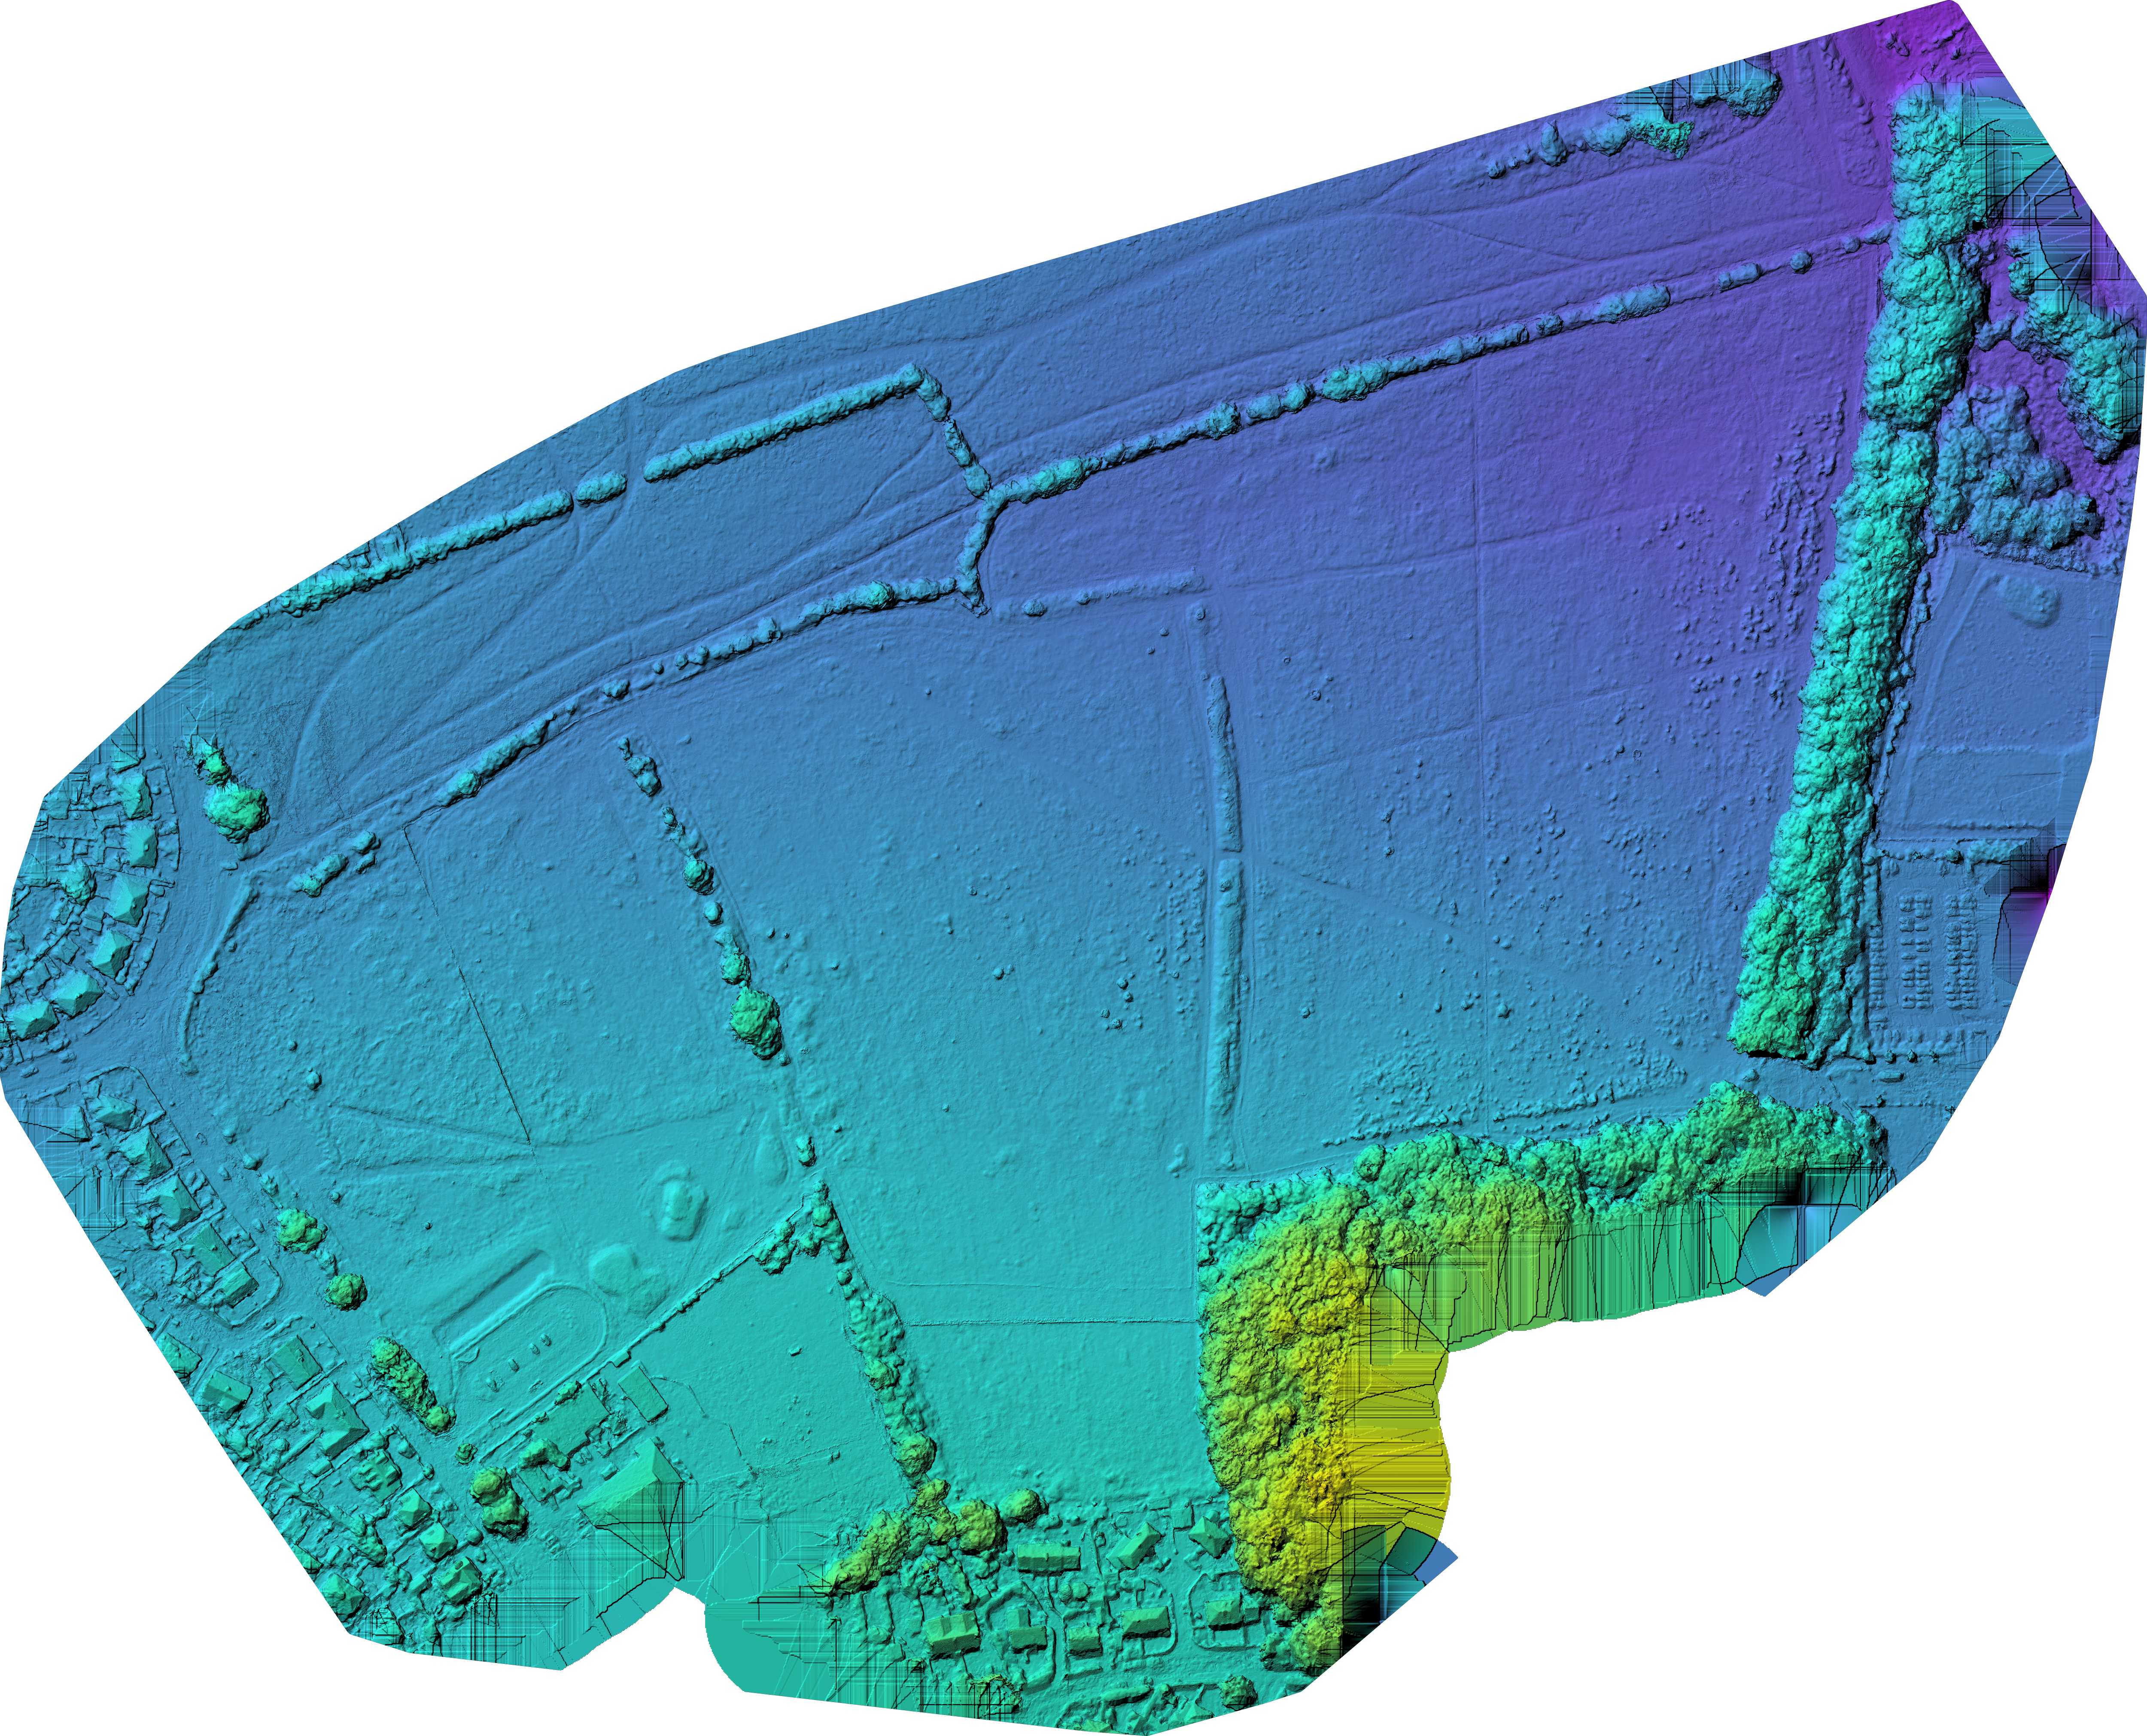
Move between the orthophoto and DSM.
Use the slider to compare the photographic site record with the elevation surface from the same survey. It gives the team immediate visual context for levels, formation and material change.
Track stockpile quantities between captures.
Material quantities can be reviewed visually and numerically in one place, giving the project and commercial teams a clearer record of change over time.
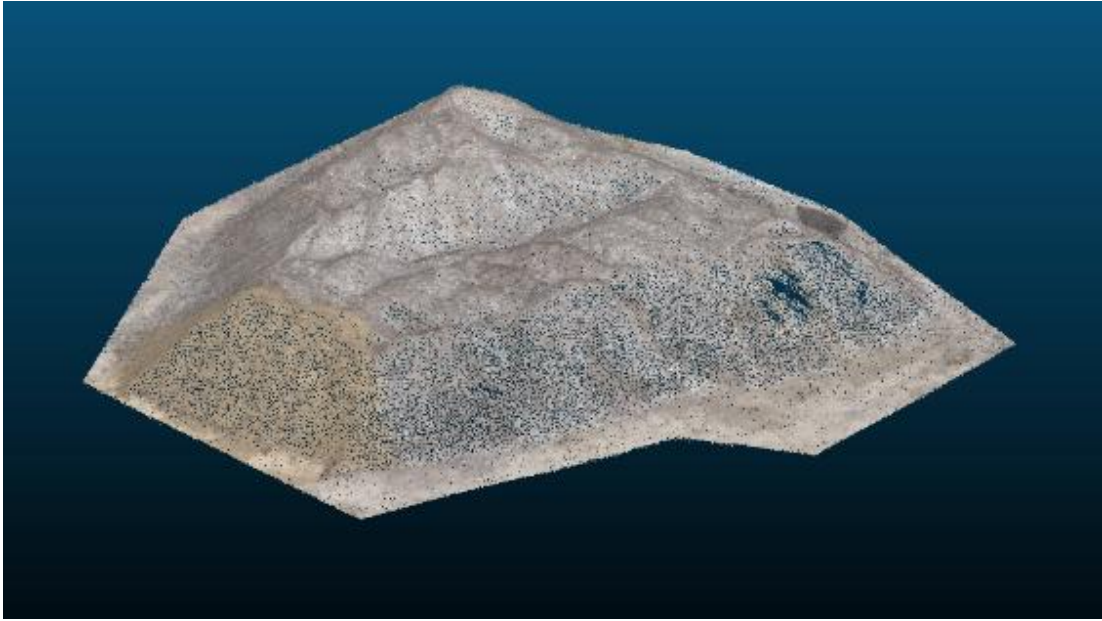
The supplied Pile 01 outputs are shown in both rendered and gradient views. The previous volume is an illustrative comparison figure for this demo.
Inspect the site from any angle.
The same capture can also provide a navigable 3D record for remote review, design coordination and general site understanding.
Site model
Drag to rotate. Scroll or pinch to inspect additional detail. Rotation and zoom are deliberately limited to keep the model easy to navigate.
A live viewer can keep current and historic models, orthophotos, DSMs, progress imagery and downloadable project outputs together in one place.